66. Process Management - top and htop
Contents
We can view the dynamic information of all processes through two tools, top and htop, which support interactive viewing of processes.
top
The top command is a tool that can view processes in real time.
Options for top command
Here are some options for the task window.
| Option | Description |
|---|---|
| -b | Run top in batch mode. |
| -d N | Refresh task window in every N seconds. |
| -n | Limit the number of batches produces by top. |
Task Window Commands for top
Here are some interactive commands for the top interactive interface.
Here are some summary global commands for the task window.
| Command | Description |
|---|---|
| d or s | Change the refresh the task window in every N seconds. |
| k | Kill the process which ID matches the specified integer number. |
| q | Quit the task windows. |
Here are some summary area commands for the task window.
| Command | Description |
|---|---|
| l | Shows or hides the average load and system uptime. |
| t | Show or hide tasks and CPU summary information. |
| m | Show or hide memory and swap memory usage. |
| 1 | Show all CPU usage summaries individually or jointly. |
Here are some descending sorting commands for the task window.
| Command | Description |
|---|---|
| A | Sort by start time. |
| M | Sort by memory usage. |
| N | Sort by process ID. |
| P | Sort by CPU usage. |
| T | Sort by consumed time. |
Example of top
|
|
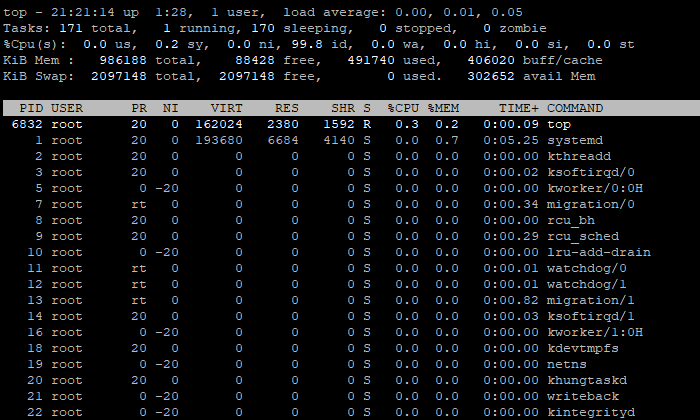
Here are the explanations of the highlighted columns:
| Column | Description |
|---|---|
| PID | The unique process ID of the task. |
| USER | Valid user name of the task owner. |
| PR | The priority of the task. |
| NI | The value of priority, the higher the value, the lower the priority. |
| VIRT | The size of virtual memory used by the task. |
| RES | The size of the non-swapped physical memory used by the task. |
| SHR | The size of shared non-swapped physical memory that may be used by other processes |
| S | The process state of the task. Possible states are: D (uninterruptible sleep), I (idle), R (running), S (sleeping), T (stopped by job control signal), t (stopped by debugger during trace), Z (zombie) |
| %CPU | The CPU usage percentage of the task. |
| %MEM | The memory usage percentage of the task. |
| TIME+ | The CPU time consumed by the task. |
| COMMAND | The command name or command line used to start the task. |
htop
The htop command is an easier-to-use top tool.
We need to install this tool first:
|
|
Options for htop command
Here are some options for the task window.
| Option | Description |
|---|---|
| -d or ‑‑delay=DELAY | Sets the interval to refresh the task window every tenths of seconds. |
| -C or ‑‑no-color or ‑‑no-colour | Displays the task window in black and white. |
| -p or ‑‑pid=PID,PID,… | Displays only those processes that match the specified process IDs. |
| -s or ‑‑sort-key COLUMN | Sort processes by the COLUMN. |
| -u or ‑‑user=USERNAME | Output only the processes own by the USERNAME. |
| -t or ‑‑tree | Output processes command name in a tree view format. |
Task Window Commands for htop
Here are some interactive commands for the top interactive interface:
| Command | Description |
|---|---|
| F1 or h or ? | Show the help screen. |
| F2 or S | Show the setup screen. We can configure the meters, options and column appearance of the summary area. |
| F3 or / | Highlighted the processes which their command name match the specified content. Press F3 for ongoing matches. |
| F4 or | Output the processes which their command name match the specified content. |
| F5 or t | Output processes command name in a tree view format. |
| F6 | Choose a column to be sorted. |
| F7 or ] | Raise a selected process’s priority. |
| F8 or [ | Reduce a selected process’s priority. |
| F9 or k | Kill a process matches the specified process ID. |
| F10 or q | Quit the task window. |
| I | Reverse the sort order. |
| u | Output only the processes owned by a specified user. |
| M | Sort by memory usage. |
| P | Sort by CPU usage. |
| T | Sort by consumed time. |
| p | Show or hide the full path of the command used to start the process. |
| Ctrl+L | Refresh the task window manually. |
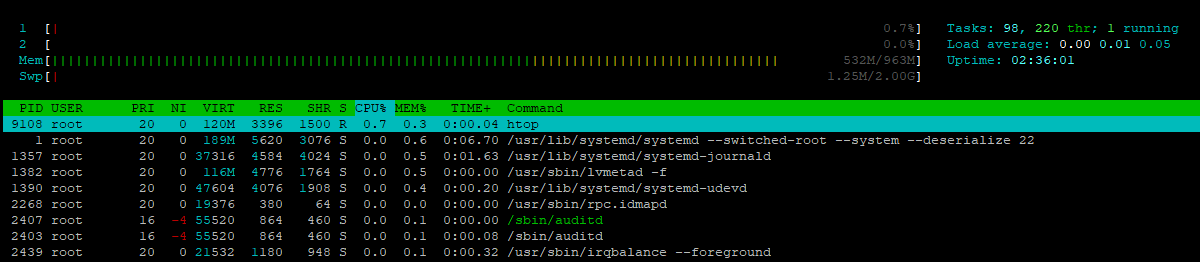
Example of htop
|
|
Author Dong Chen
LastMod Sun Apr 7 2019