68. Process Management - dstat
Contents
We can use the dstat tool to generate statistics on system resource usage.
Options
Here are some options for dstat command:
| Option | Description |
|---|---|
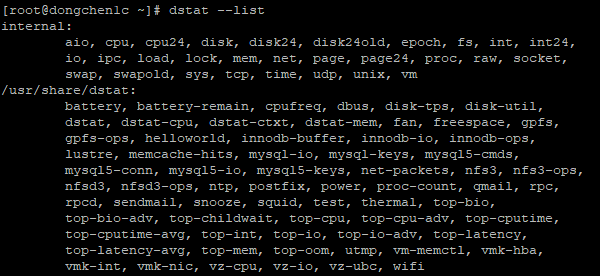
| ‑‑list | Lists the names of all available plug-ins. |
| -a or ‑‑all | Show default plugin set, this is equivalent to dstat -cdngy. |
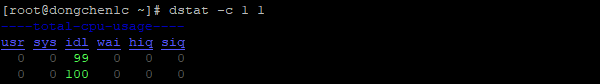
| -c or ‑‑cpu | Show CPU statistics. (system, user, idle, wait) |
| -C 0,1,N | Show CPU0, CPU1 and CPUN statistics. (Must be used with the -c or ‑‑cpu option.) |
| -d or ‑‑disk | Show disk statistic. |
| -D disk1,disk2,N | Show disk1, disk2 and N staistics. (Must be used with the -d or ‑‑disk option.) |
| -g or ‑‑page | Show page statistics. |
| -i or ‑‑int | Show interrupt statistics. |
| -I 27,28,N | Show interrupt 27, 28 and N. (Must be used with the -i or ‑‑int option.) |
| -l or ‑‑load | Show load average statistics. (1, 5, 15 mins) |
| -m or ‑‑mem | Show memory statistics. |
| -n or ‑‑net | Show network I/O statistics. |
| -N eth1,eth2,N | Show network interface eth1, eth2 and N. (Must be used with the -n or ‑‑net option.) |
| ‑‑net-packets | Displays received and sent network packets. |
| -p or ‑‑proc | Show process statistics. |
| ‑‑proc-count | Displays the total number of processes. |
| -r or ‑‑io | Show I/O request statistics. |
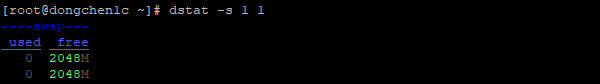
| -s or ‑‑swap | Show swap statistics. |
| -S swap1,swap2,N | Show swap1, swap2 and N statistics. (Must be used with the -s or ‑‑swap option.) |
| ‑‑snooze | Show the number of seconds consumed per row. |
| -t or ‑‑time | Show each row’s output time. |
| -T or ‑‑epoch | Show each row’s output timestamp. |
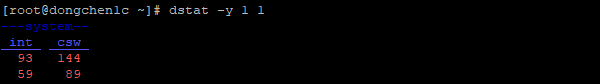
| -y or ‑‑sys | Show system statistics. (interrupts, context switches) |
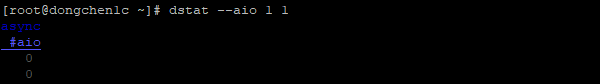
| ‑‑aio | Show aio statistics. |
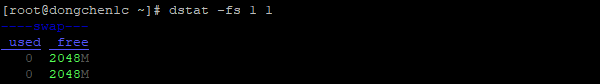
| ‑‑fs or ‑‑filesystem | Show filesystem statistics. (open files, inodes) |
| ‑‑freespace | Used and usable space for each file system. (A window with a width of 2700 pixels or more is required) |
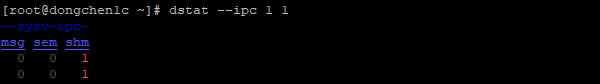
| ‑‑ipc | Show ipc statistics. (message queue, semaphores, shared memory) |
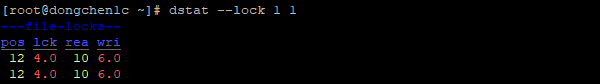
| ‑‑lock | Show file lock statistics. (posix, flock, read, write) |
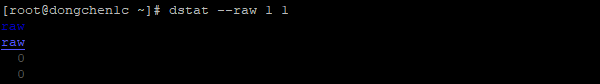
| ‑‑raw | Show raw sockets statistics. |
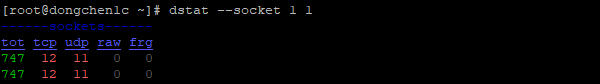
| ‑‑socket | Show socket statistics. (total, tcp, udp, raw, ip-fragments) |
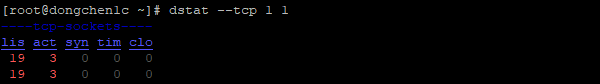
| ‑‑tcp | Show tcp statistics. (listen, established, syn, time_wait, close) |
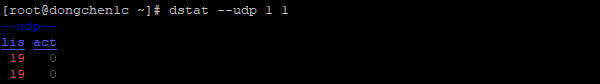
| ‑‑udp | Show udp statistics. (listen, active) |
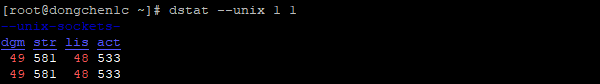
| ‑‑unix | Show unix statistics. (datagram, stream, listen, active) |
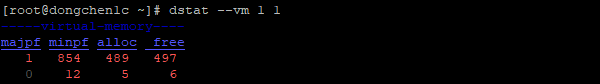
| ‑‑vm | Show virtual memory statistics. (hard pagefaults, soft pagefaults, allocated, free) |
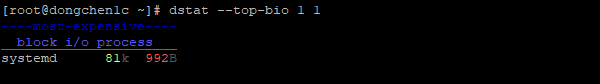
| ‑‑top-bio | Show the block I/O process that consumes the most. |
| ‑‑top-bio-adv | Show the block I/O process that consumes the most. (include the process PID) |
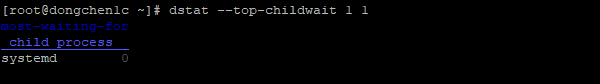
| ‑‑top-childwait | Show the process that has been waiting for the child process for the longest time. |
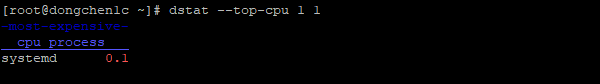
| ‑‑top-cpu | Show the CPU process that consumes the most. |
| ‑‑top-cpu-adv | Show the CPU process that consumes the most. (include the process PID) |
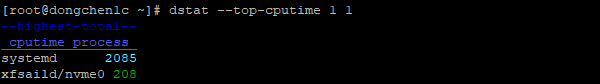
| ‑‑top-cputime | Show the process that consumes the most CPU time. (in milliseconds) |
| ‑‑top-cputime-avg | Shows the process with the highest average time slice. (in milliseconds) |
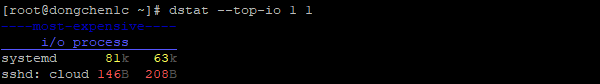
| ‑‑top-io | Show the I/O process that consumes the most. |
| ‑‑top-io-avg | Show the I/O process that consumes the most. (include the process PID) |
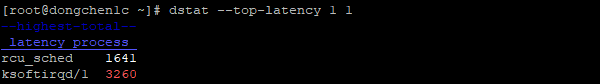
| ‑‑top-latency | Show the process with the highest latency. (in milliseconds) |
| ‑‑top-latency-avg | Show the process with the highest average latency. (include the process PID) |
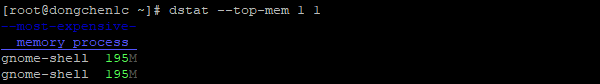
| ‑‑top-mem | Show the process that consumes the most memory. |
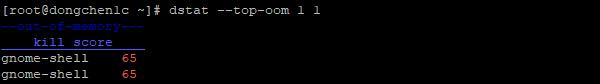
| ‑‑top-oom | Show the process that is most likely to be killed by the out-of-memory killer. |
| -f or ‑‑full | Show the contents similar to the expansion of the CDINS options. |
| ‑‑bits | Converts values displayed in bytes to bits. |
| ‑‑float | Show values as floating points. |
| ‑‑integer | Show values as integer points. |
| ‑‑bw or ‑‑blackonwhite | Show non-empty values. |
| ‑‑nocolor | Show black and white content. |
| ‑‑noheaders | Show headers once. |
Examples
Output All Available Plug-ins
|
|
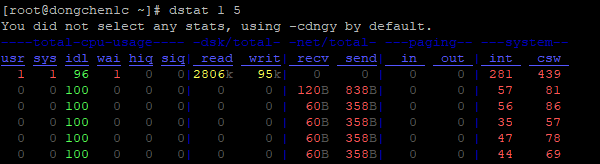
Output One Row Per Second Five Lines in Total
|
|
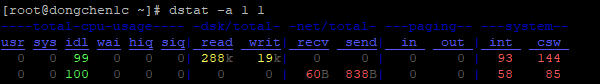
Output All Default Plugin Set
|
|
Output CPU Statistics
|
|
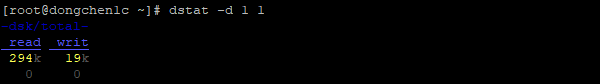
Output Disk Statistics
|
|
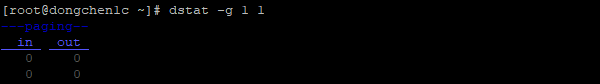
Output Page Statistics
|
|
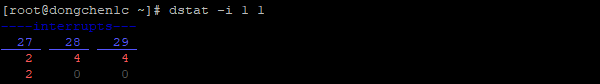
Output Interrupt Statistics
|
|
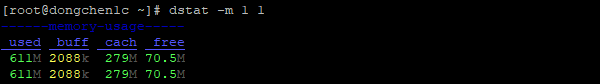
Output Memory Statistics
|
|
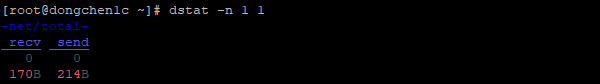
Output Network Statistics
|
|
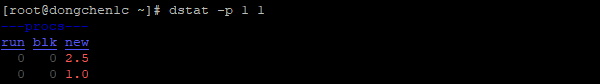
Output Process Statistics
|
|
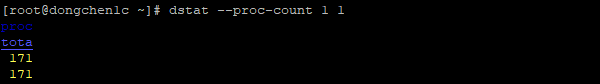
Output Process Amount
|
|
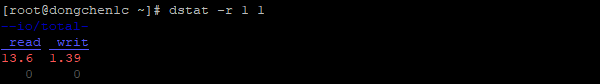
Output I/O Statistics
|
|
Output Swap Statistics
|
|
Output System Statistics
|
|
Output AIO Statistics
|
|
Output Filesystem Statistics
|
|
Output Statistics of Used and Usable Space
|
|

Output IPC Statistics
|
|
Output File Lock Statistics
|
|
Output Raw Sockets Statistics
|
|
Output Socket Statistics
|
|
Output TCP Statistics
|
|
Output UDP Statistics
|
|
Output UNIX Statistics
|
|
Output Virtual Memory Statistics
|
|
Output Block I/O Processes that Consumes the Most
|
|
Output Processes that Has Been Waiting for Child Processes for the Longest Time
|
|
Output CPU Processes that Consumes the Most
|
|
Output Processes that Consumes the Most CPU Time
|
|
Output I/O Processes that Consumes the Most
|
|
Output Processes With the Highest Latency
|
|
Output Processes that Consumes the Most
|
|
Output Processes that is Most Likely to be killed by the Out-Of-Memory Killer
|
|
References PCP-DSTAT(1)
Author Dong Chen
LastMod Tue Apr 9 2019