The amount of blocks received from a block device.
bo
The amount of blocks sent to a block device.
VM Fields under System area
Field
Description
in
The amount of interrupts per second, including the
clock.
cs
The amount of context switches per second.
VM Fields under CPU area
Field
Description
us
The amount of time spent running non-kernel code, that
is, user time, including nice time.
sy
The time spent running the kernel code, that is, system
time.
id
The amount of time spent in the idle state.
wa
The amount of time spent waiting for IO.
st
The amount of time stolen from the virtual machine.
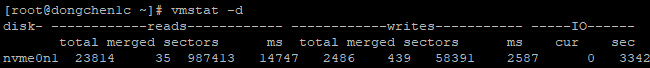
Disk Mode Fields
Disk Fields under Reads area
Field
Description
total
Total number of successful reads.
merged
The number of combined reads in a IO.
sectors
The number of successful sector reads.
ms
The number of milliseconds consumed by the read
operation.
Disk Fields under Writes area
Field
Description
total
Total number of successful writes.
merged
The number of combined writes in a IO.
sectors
The number of successful sector writes.
ms
The number of milliseconds consumed by the write
operation.
Disk Fields under IO area
Field
Description
cur
Number of IO in Progress.
s
The number of seconds consumed by the IO operation.
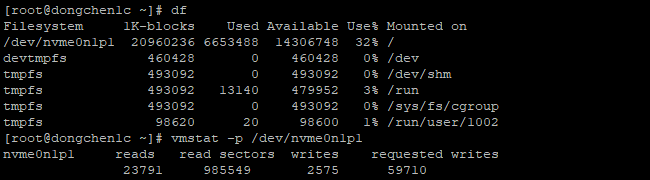
Disk Partition Mode Fields
Field
Description
reads
The number of read operations assigned to the specified
partition.
read sectors
The number of read sectors for the specified partition.
writes
The number of write operations assigned to the specified
partition.
requested
The number of write requests made for the specified
partition.
Slab Mode Fields (Buffer)
Field
Description
cache
The name of the cache.
num
The number of currently active objects.
total
The total number of objects available.
size
The size of each object.
pages
The number of pages with at least one active object.
Options
Here are some options for vmstat command:
Option
Description
-a or ‑‑active
Displays active and inactive memory information.
-f or ‑‑forks
Displays the number of forks from system startup to the
present, which includes fork,vfork and clone system
calls. This is consistent with the number of tasks
created.
-m or ‑‑slabs
Displays cache information.
-n or ‑‑one-header
The header will only be displayed once.
-s or ‑‑stats
Displays the cumulative number of events and memory
statistics in tabular form.
-d or ‑‑disk
Displays the statistics for disks.
-D or ‑‑disk-sum
Displays summary statistics of disk activity.
-p or ‑‑partition device
Detailed statistics of the specified partition.
-S or ‑‑unit character
Displays the values in a specified unit. Available units
are: k=per 1000 bytes, K=per 1024 bytes, m=per 1000000
bytes, M=per 1048576 bytes.
-t or ‑‑timestamp
Appends the current timestamp to the end of each line.
-w or ‑‑wide
Each line will be output in wide mode, which can be more
than 80 characters wide.
Usage
1
vmstat [options][delay [count]]
delay: Output new data every delay second.
count: The total number of outputs of the data. (This is
located behind the delay option)
Examples
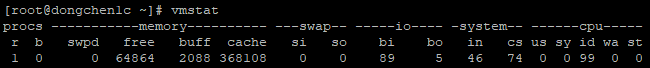
1
vmstat
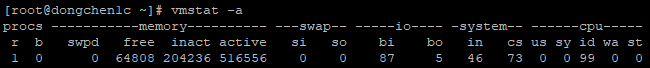
Show Active and Inactive Memory Information
1
vmstat -a # This is equivalent to vmstat --active
Show Number of Forks
1
vmstat -f # This is equivalent to vmstat --forks
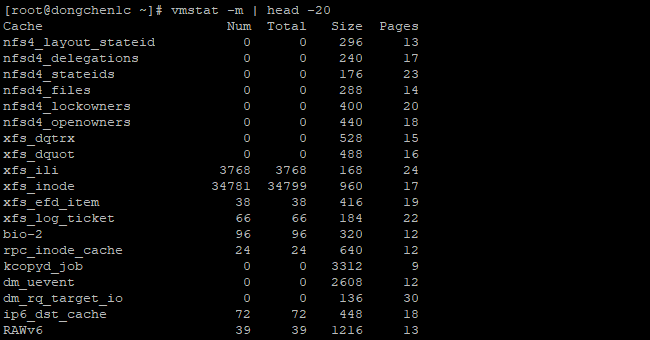
Show First Twenty Lines of Cache Information
1
vmstat -m # This is equivalent to vmstat --slabs
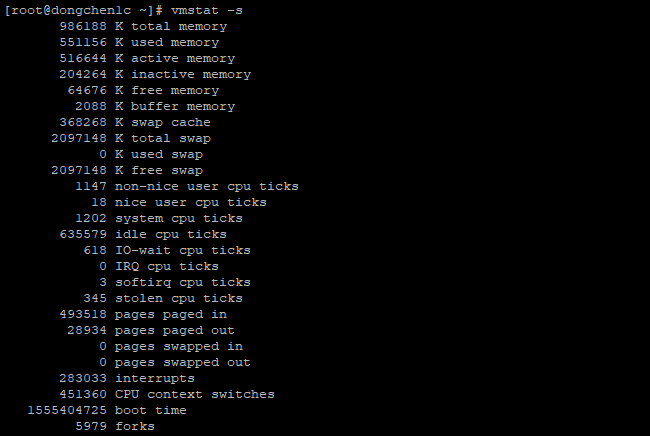
Show Events and Memory Statistics
1
vmstat -s # This is equivalent to vmstat --stats
Show Disks Statistics
1
vmstat -d # This is equivalent to vmstat --disk
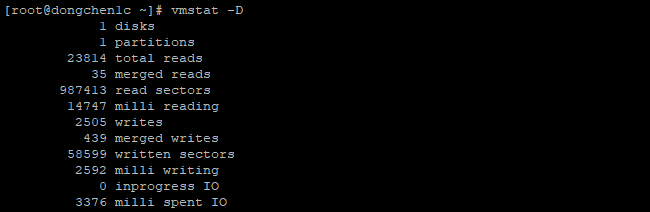
Show Disks Summary Statistics
1
vmstat -D # This is equivalent to vmstat --disk-sum
Show the Detailed Partition Statistics
1
2
df
vmstat -p /dev/nvme0n1p1   # This is equivalent to vmstat --partition /dev/nvme0n1p1
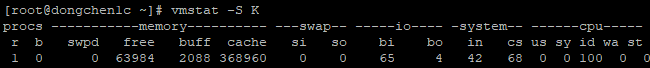
Show Reports in 1024 Kilobytes Per Unit
1
2
df
vmstat -S K   # This is equivalent to vmstat --unit K
Show Current Datetime at the End of Each Line
1
2
df
vmstat -t   # This is equivalent to vmstat --timestamp
Show Each Line in Wide Mode
1
2
df
vmstat -w   # This is equivalent to vmstat --wide